The UK’s electricity system price reached a record high of £2,242/MWh on Wednesday 4th March 2020 – nearly double the previous highest power price – following lower than expected wind generation during the evening peak.
The system price spiked to the £2,242/MWh mark during the settlement period (SP) 37 (6:00-6:30 pm) and remained high at £1,708/MWh during SP 38 (6:30-7:00 pm). The highest level since 30th November 2015.
Using Hartree’s unparalleled modelling we were able to predict and benefit from these record-high prices and pass the wins on to our customers.
What caused the jump on the 4th March?
Quite simply, this tightness in the system was caused by 1) higher demand than was forecast, 2) low wind, and 3) a lack of fast response margin available on the system.
These circumstances lead to National Grid calling on its short-term operating reserve (STOR), a service that is contracted for events of system stress, resulting in the system imbalance price being calculated using the Loss of Load Probability (LOLP) and the Reserve Scarcity Price. The LOLP is a National Grid calculation reflecting the probability of a blackout and prices such an event at the Reserve Scarcity Price, currently set at £6,000/MWh.
What did we do to predict and benefit from the spike?
Our team of analysts used our bespoke in-house systems to model this event, the blackout risk and forecast the cost of imbalance. Let us show you what we did:

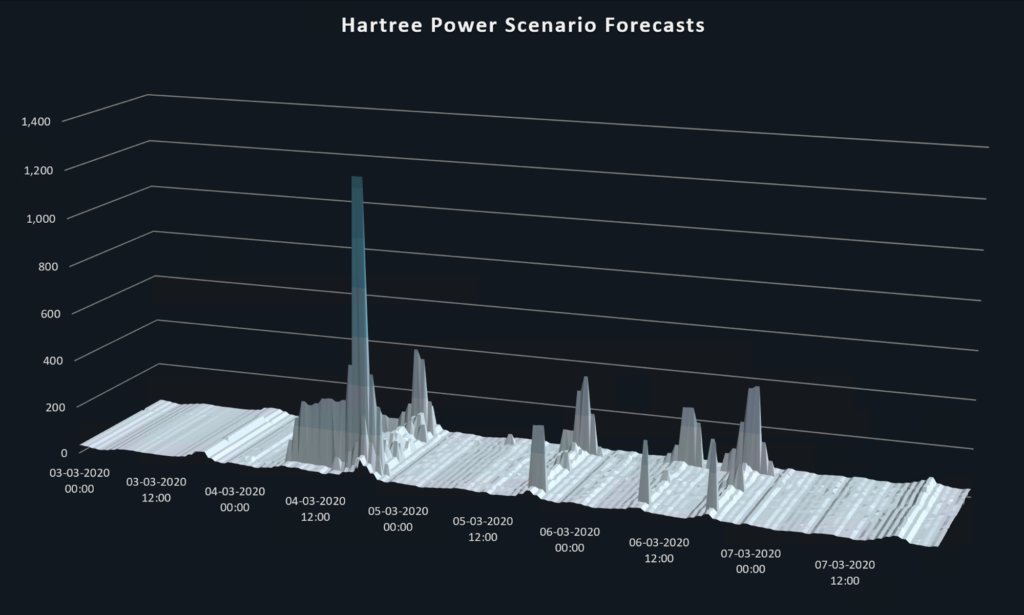
The chart above is our 5-day view of power price modelling covering the March event – as generated the day prior.
The chart’s depth represents Hartree’s scenario analysis. Over a hundred fundamental scenarios are run to represent the uncertainty of key fundamentals such as wind generation, demand and plant availability to name a few. You can see how the day before the event (the 3rd March) we forecast the power price volatility to be relatively benign as we did again several days later on the 7th March. When spare thermal margin becomes small enough the price reaction can be exponential which is as we forecast for the 4th March in many of our scenarios above. As you can see, we successfully identified the risk that became reality.
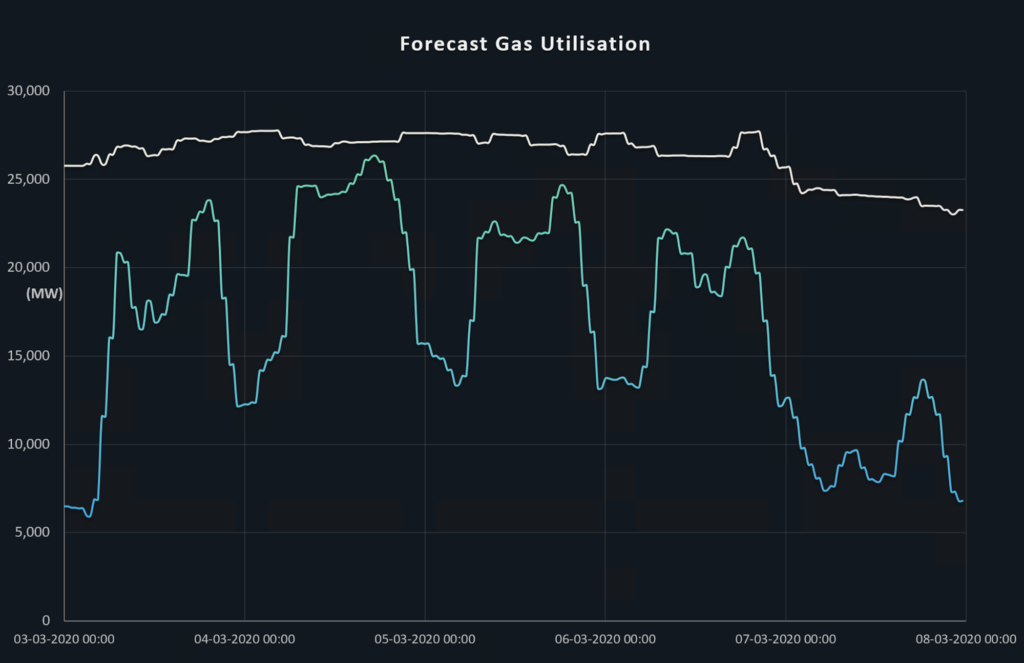
Identifying the lack of spare thermal margin is best highlighted by the chart below.

How our customer benefited?
We were able to identify the risk of high system prices, our customers that have flexibility were able to benefit from them. Whereas other suppliers and route-to-market providers may optimise customers assets for their own benefit, we directly pass these benefits on to our customers via our integrated supply business. Only by having the combination of our market-leading analysis combined with our supply business, is this possible.
It puts the power back into their hands – and is the unique difference between Hartree Solutions and others in the market.
How we’re planning to stay ahead of future power price volatility
As the market reacts to these unprecedented events, rest assured, Hartree Solutions will remain at the forefront of predicting these events and monetising them. Our UK Power outlook forecasts increasing price volatility, both high and low-price events with an increasing frequency never seen before.
Heavy data analysis is one of our core strengths and it can only reap rewards for our clients as more and more price volatility feeds into the UK energy market and creates more risk to end-users, but also more wins for Hartree’s customers.

Adam Lewis


