Up until now, the UK has prioritised keeping the lights on and consumer bills down ahead of environmental concerns. In other words, the security of supply and price are put above carbon intensity in the energy trilemma of the UK.
This priority could be set to change as Britain gets serious about its 2050 net-zero target. As we highlighted in our previous article there is still a lot of work to be done to achieve this aim or even the mid-term goal of a 68% cut in greenhouse gas emissions by 20301.
Companies are waking up to the importance of sourcing low carbon generation, yet the current design of power markets makes this both hard to achieve and difficult to quantify (something we discuss in a future thought leadership piece). For example, Volkswagen just announced2 that its top executives’ bonuses will be linked to its ESG targets and last month Sony hinted3 at leaving Japan due to limited access to clean energy with the carbon intensity of the country’s electricity network more than twice that of the UK.
In Part 2 of this series, we:
- Highlight the challenges the UK faces to reduce carbon from power generation over the coming decade;
- Demonstrate how our choices greatly impact the UK’s efforts to continue to reduce overall carbon emissions;
- Introduce the concept of the marginal power unit in the UK system and its importance on carbon emission reductions;
- Show that measuring carbon on an annual basis is nowhere near detailed enough for the UK to achieve its goal, with a much more granular, half-hourly view on carbon intensity required, just like we have on prices and,
- Underline the importance of working with a market-leading energy partner to ensure businesses achieve maximum emission reduction.
The Marginal Unit
Newton’s third law states that ‘for every action, there is an equal and opposite reaction’
In the power stack, the lowest cost generation is used first while the last generating unit required to meet demand typically sets the price4. This is known as the marginal unit or price-setting unit. Our analysis in this second article highlights the key role this marginal unit will play in reducing the UK’s carbon intensity.
The relevance of Newton’s third law to electricity is that by turning on a generating asset we are displacing an alternative source of production. Yet these decisions are made based on price and not emissions. But to meet the emission goals we need to be considering the carbon impact of these actions as well as the cost of supply.
Through Hartree Solutions’ in-house modelling, we can extract a marginal balancing unit for each hour5, rather than an annual basis more typical within the industry. We can do this from both a forward-looking perspective and a retrospective view.
Granular Carbon Analysis
Our highly granular approach gives us a great insight into historic, real-time and forecast carbon emissions. This allows us to design long-term solutions to reduce the carbon content of a company’s electricity use and ultimately completely offset it.
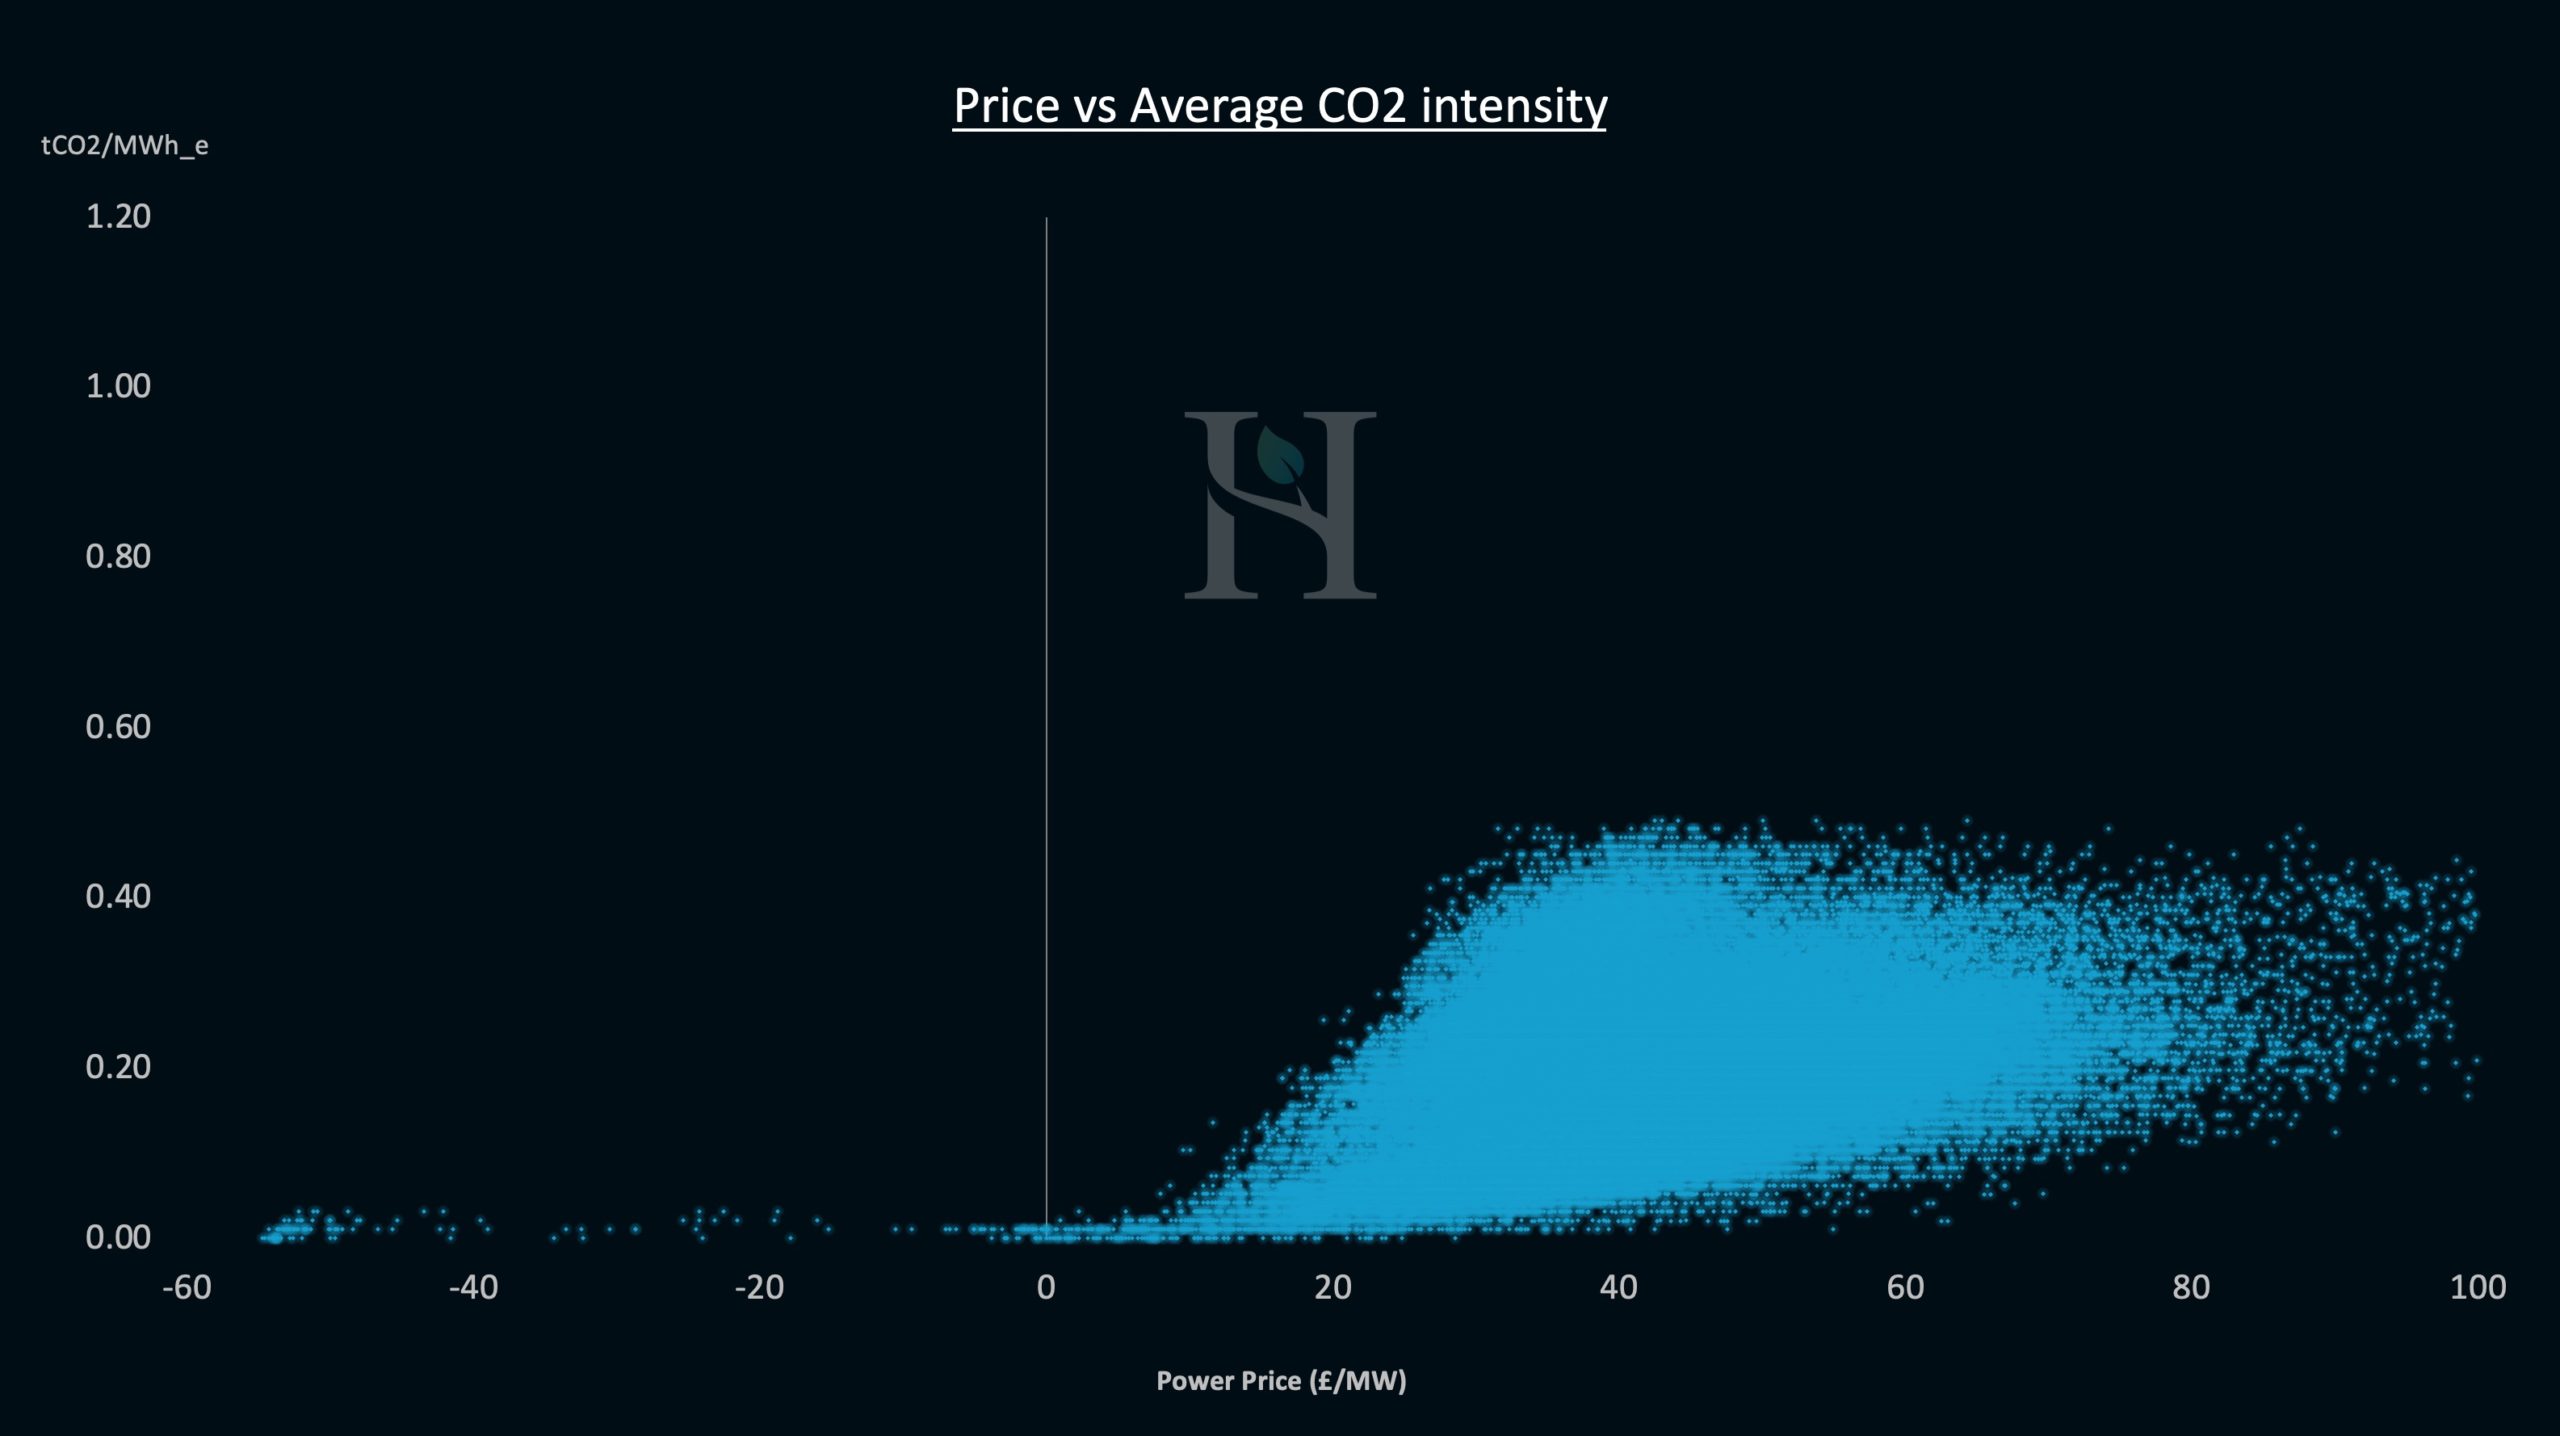
Using this model, when we analyse the relationship between the grid’s average carbon intensity and the power price, we see a good correlation. As power prices increase, the average carbon intensity of the grid also increases.
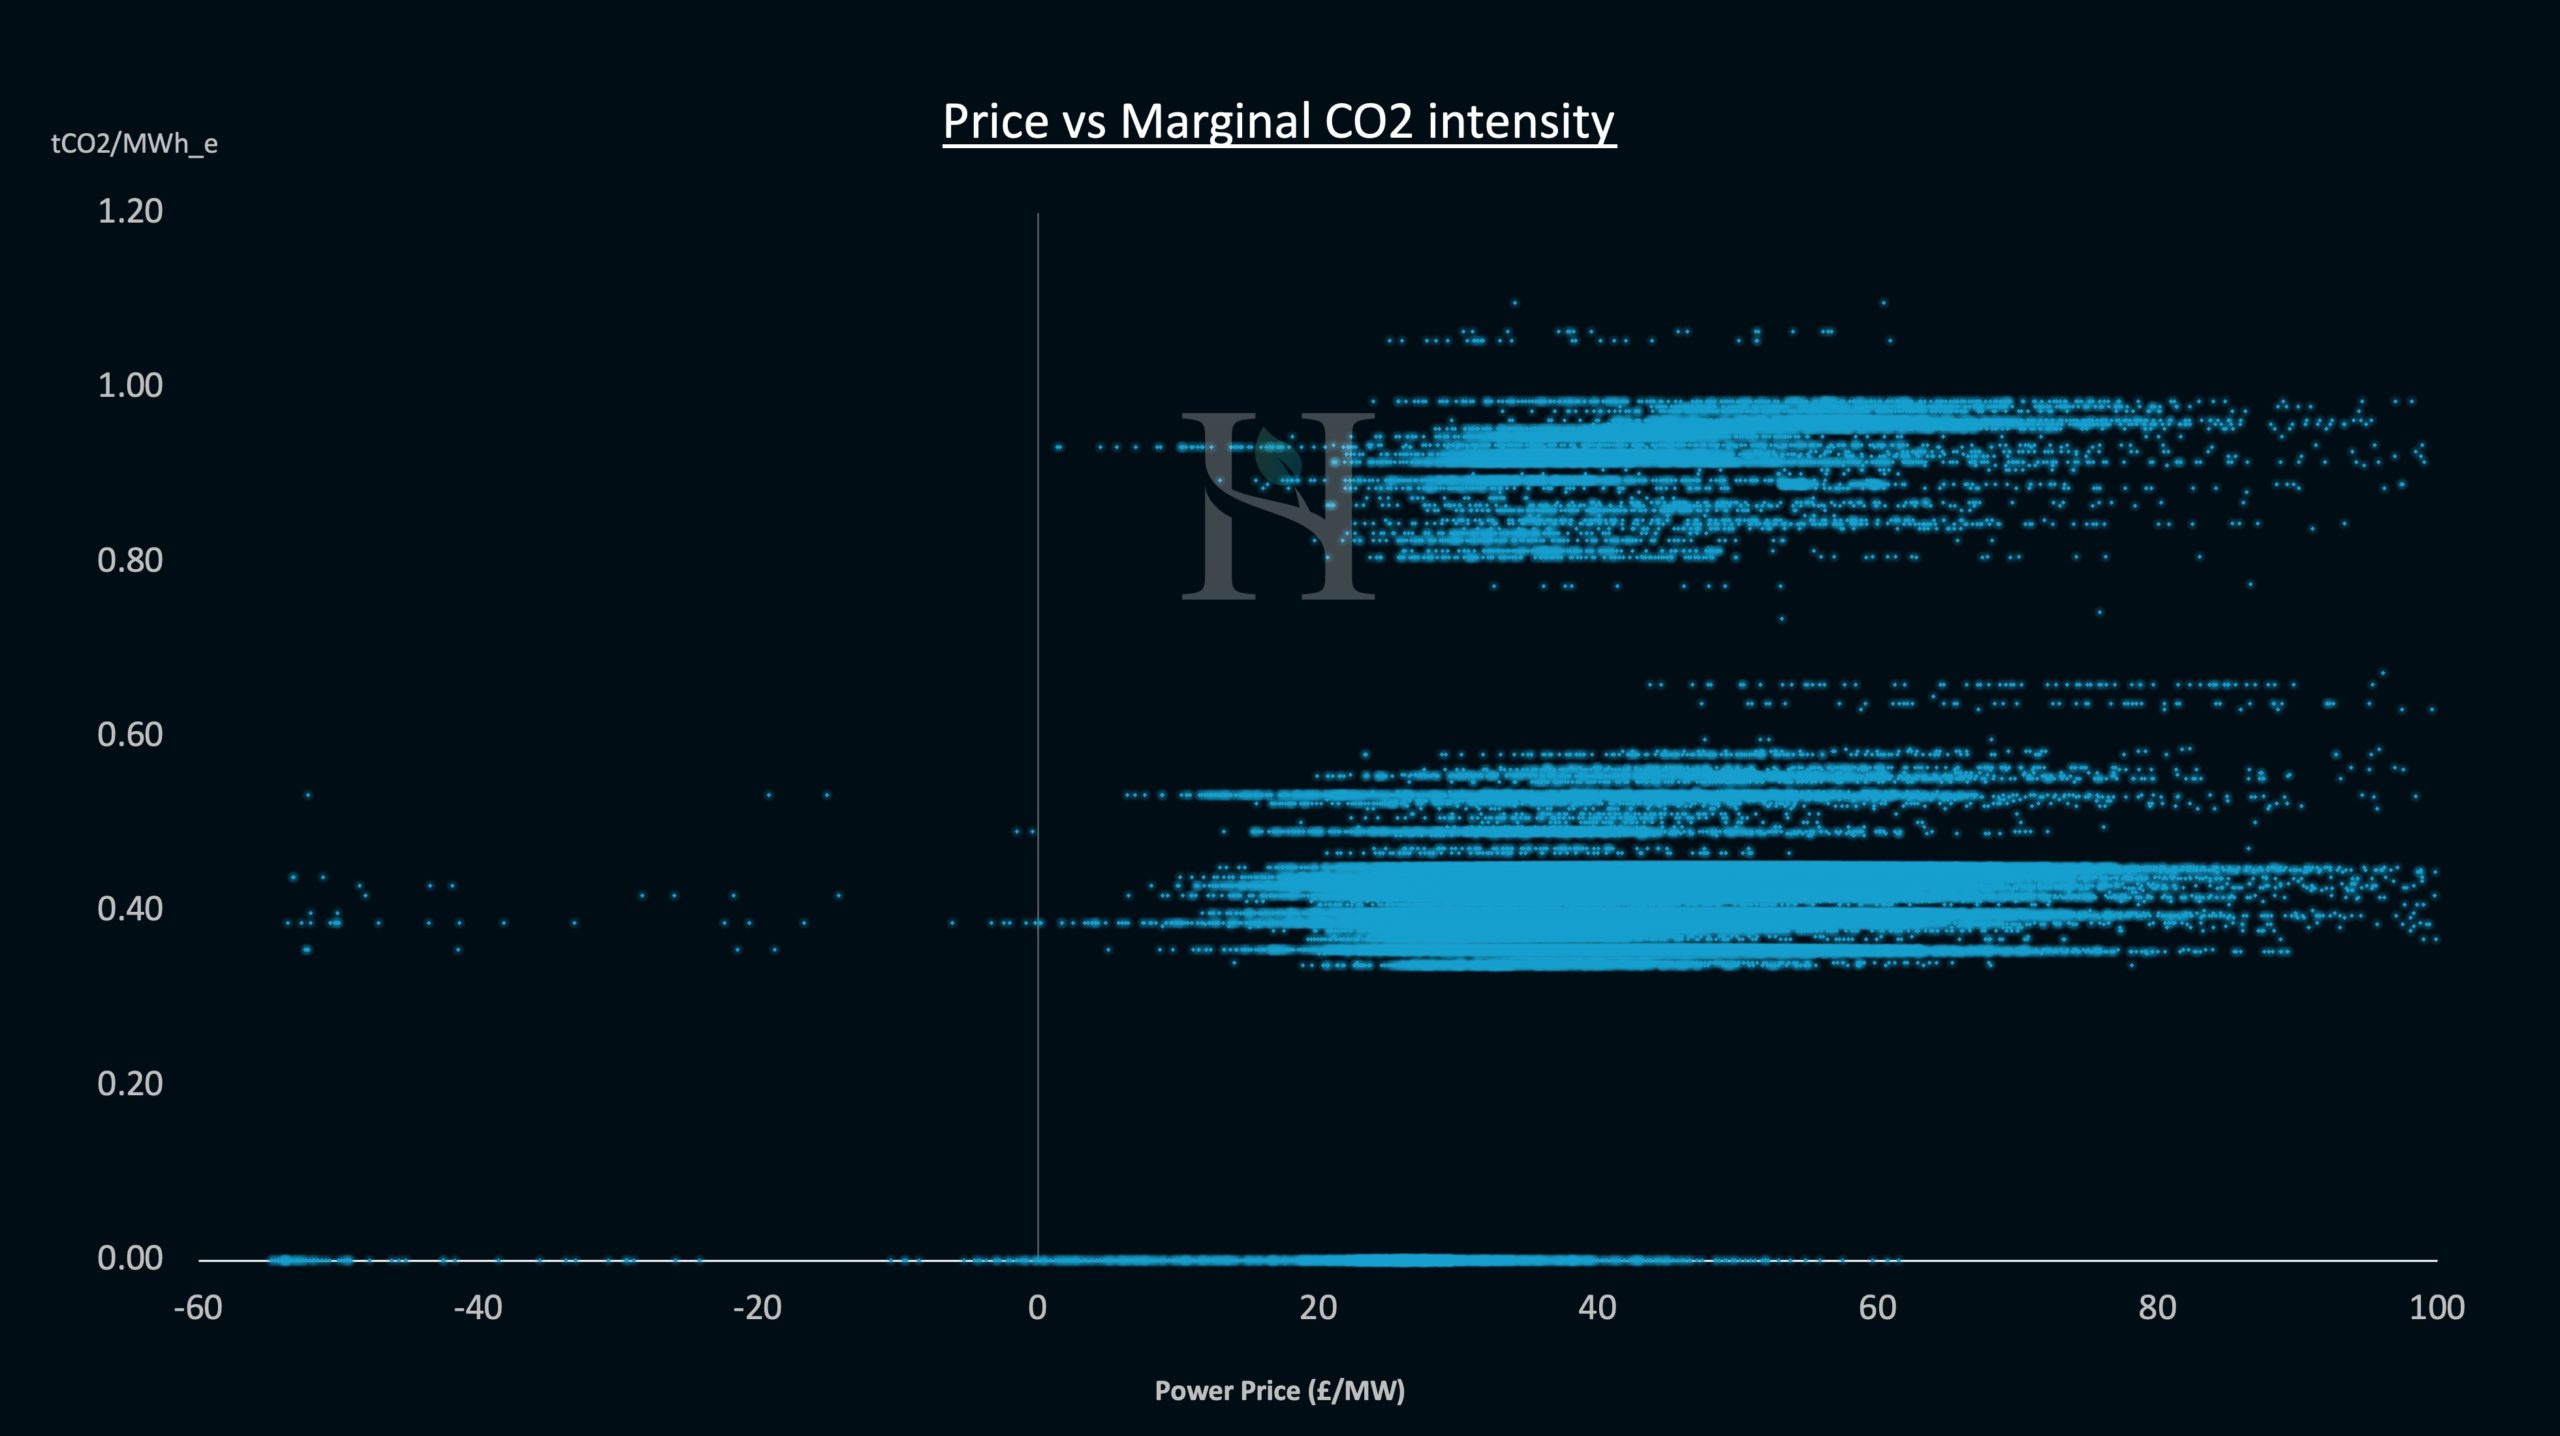
However, when we look at the carbon intensity of the price-setting unit and the power price, this correlation breaks down. This highlights the impact of a regulatory framework that favours keeping prices down over carbon intensity and can act as a handbrake on the UK’s success in continuing to reduce power emissions.
Further, we are also able to demonstrate the poor correlation between the actual carbon impact of your actions (the marginal units carbon intensity) and the average carbon intensity. This highlights the issues in using the average carbon intensity as the driver for our decisions as it can actually lead to increased carbon emissions in the UK.
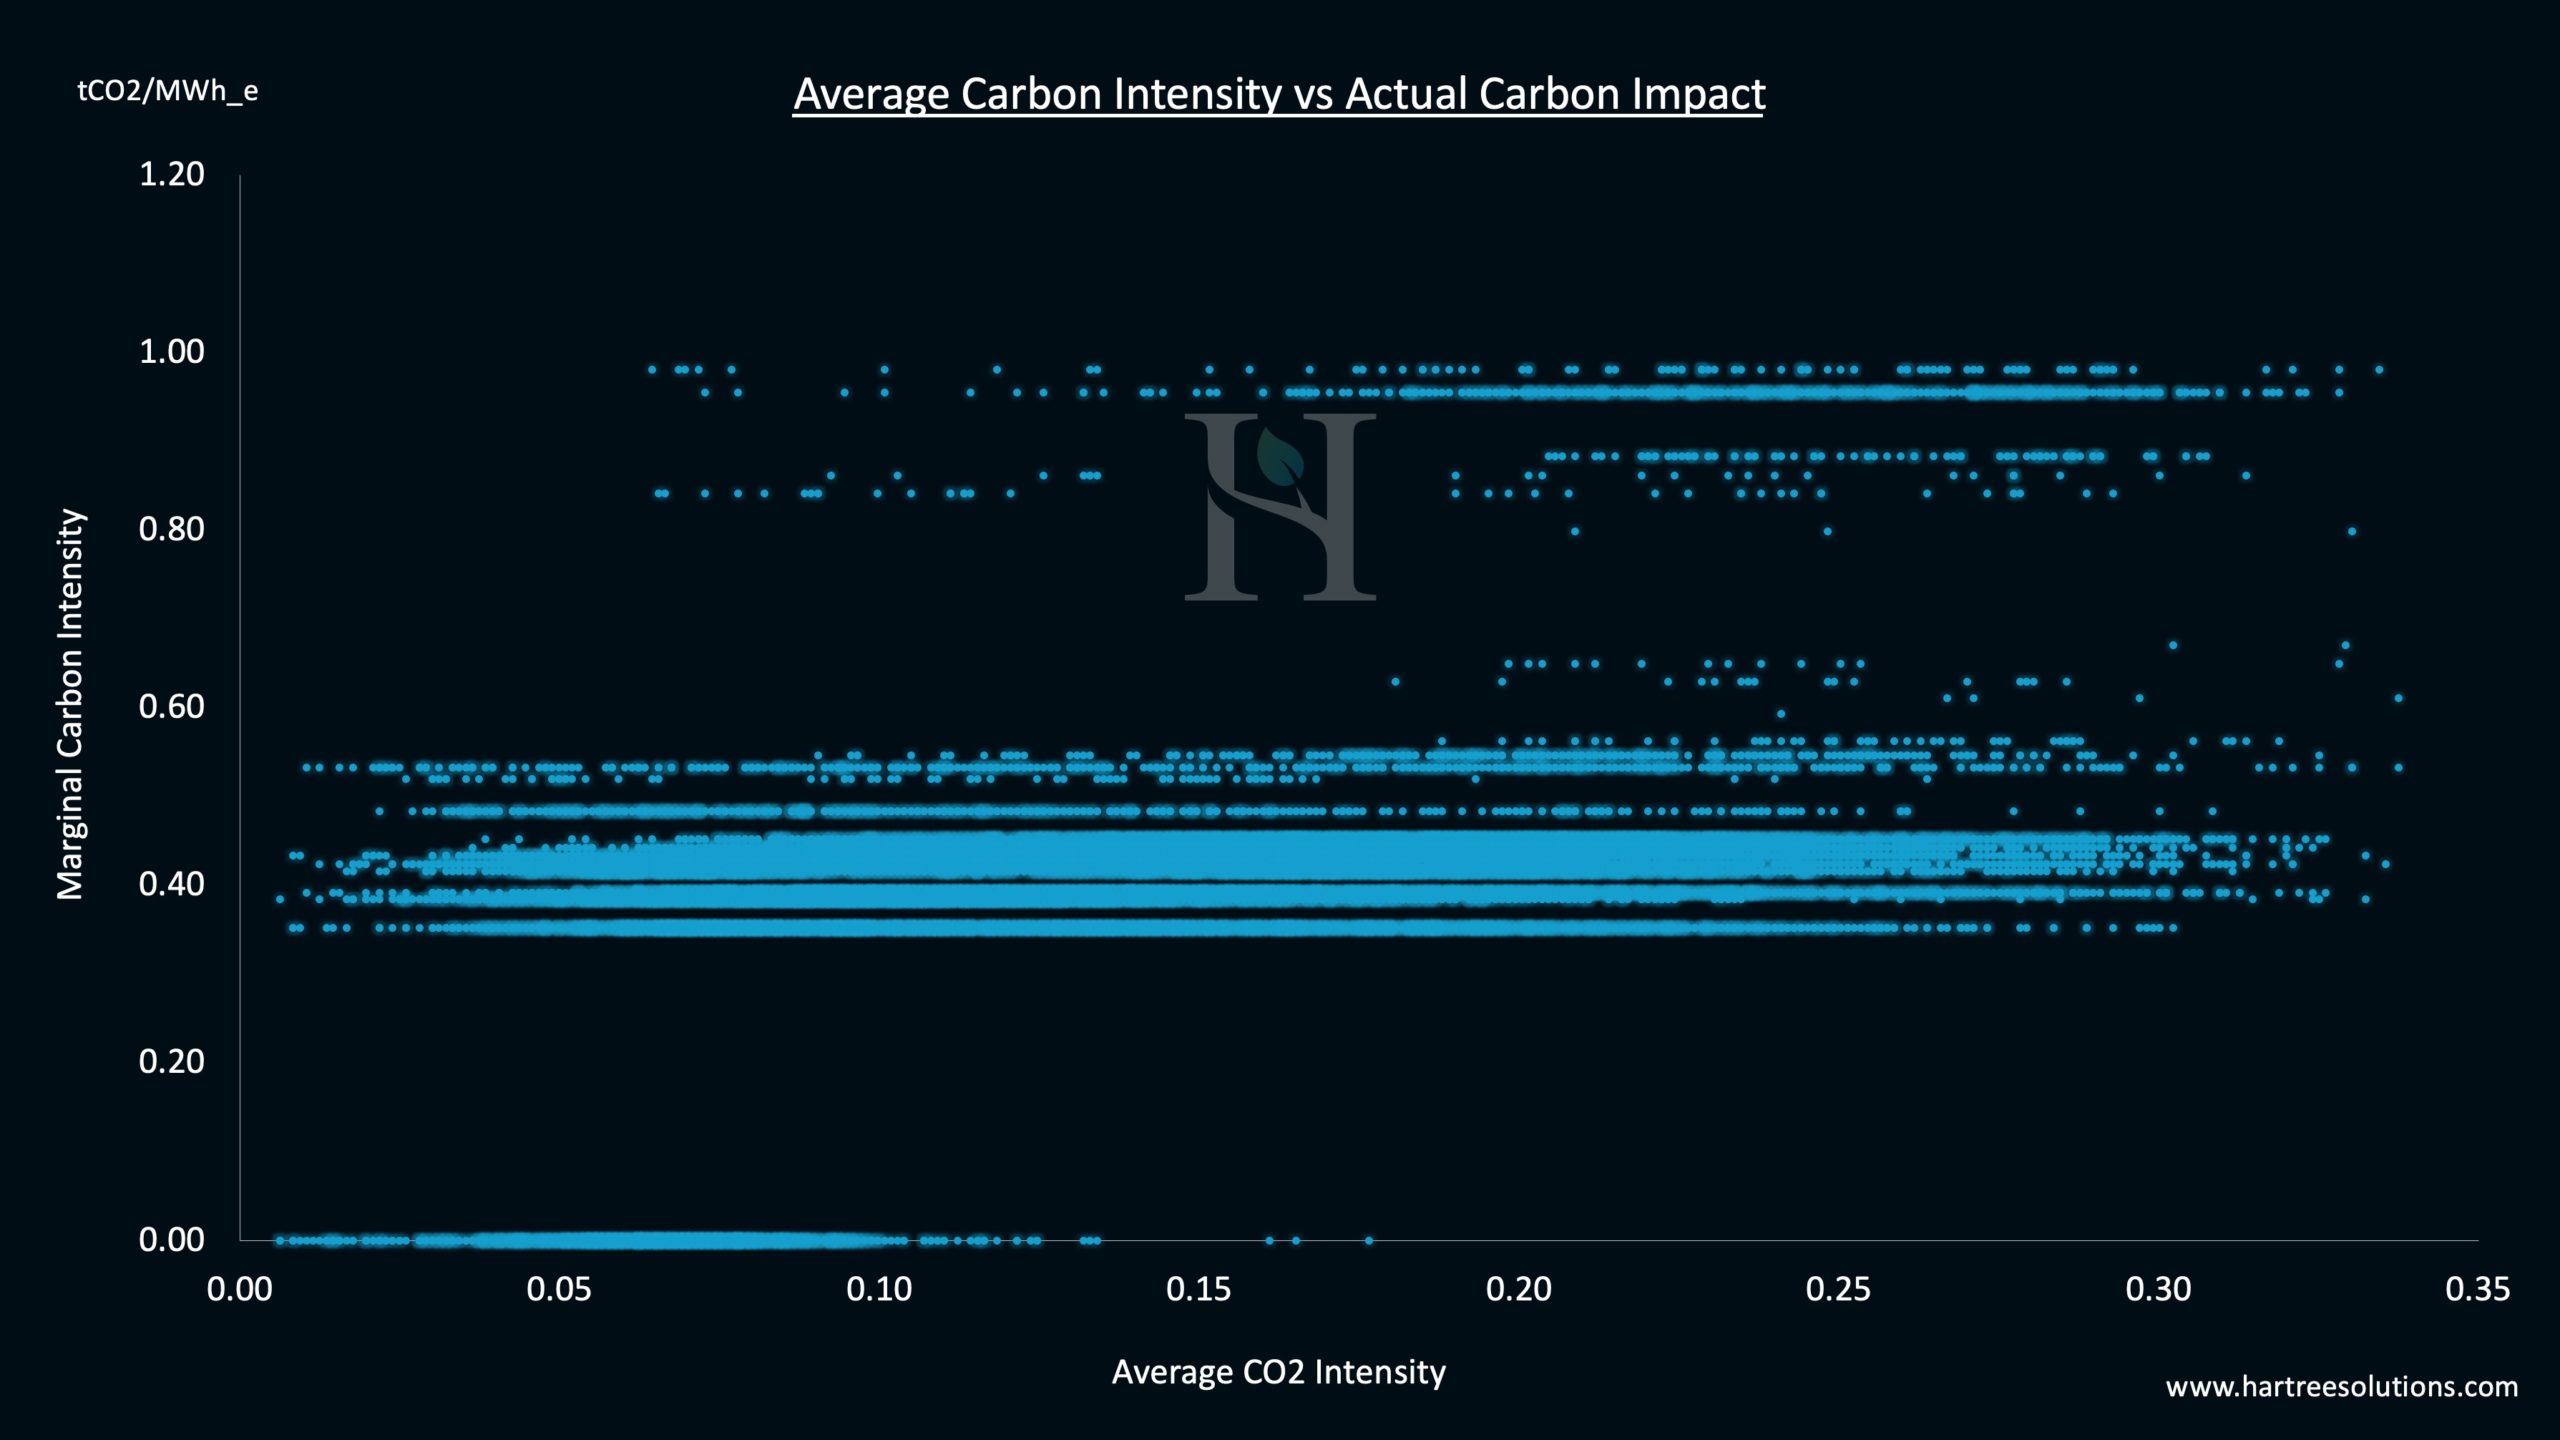
When the grid has a high percentage of low carbon generation but still needs some high carbon generation to meet demand, we could be fooled into thinking that we should look only at the low average carbon intensity and that further carbon reductions are not possible. Yet, where we can substitute this high carbon intensity grid generation with lower carbon local generation, we can further reduce the UK’s total emissions. This is why measuring specific consumers and on-site sources of generation against the marginal carbon intensity of the network is key if the UK is to continue reducing emissions at the rate required.
Choosing the Right Energy Partner
If you are serious about truly reducing the carbon impact of your business it is essential to work with the right energy partner that is not only able to measure and forecast the carbon-intensity of the network but also able to optimise your energy usage in real-time to benefit you as a consumer. We believe this is a unique skillset of Hartree Solutions.
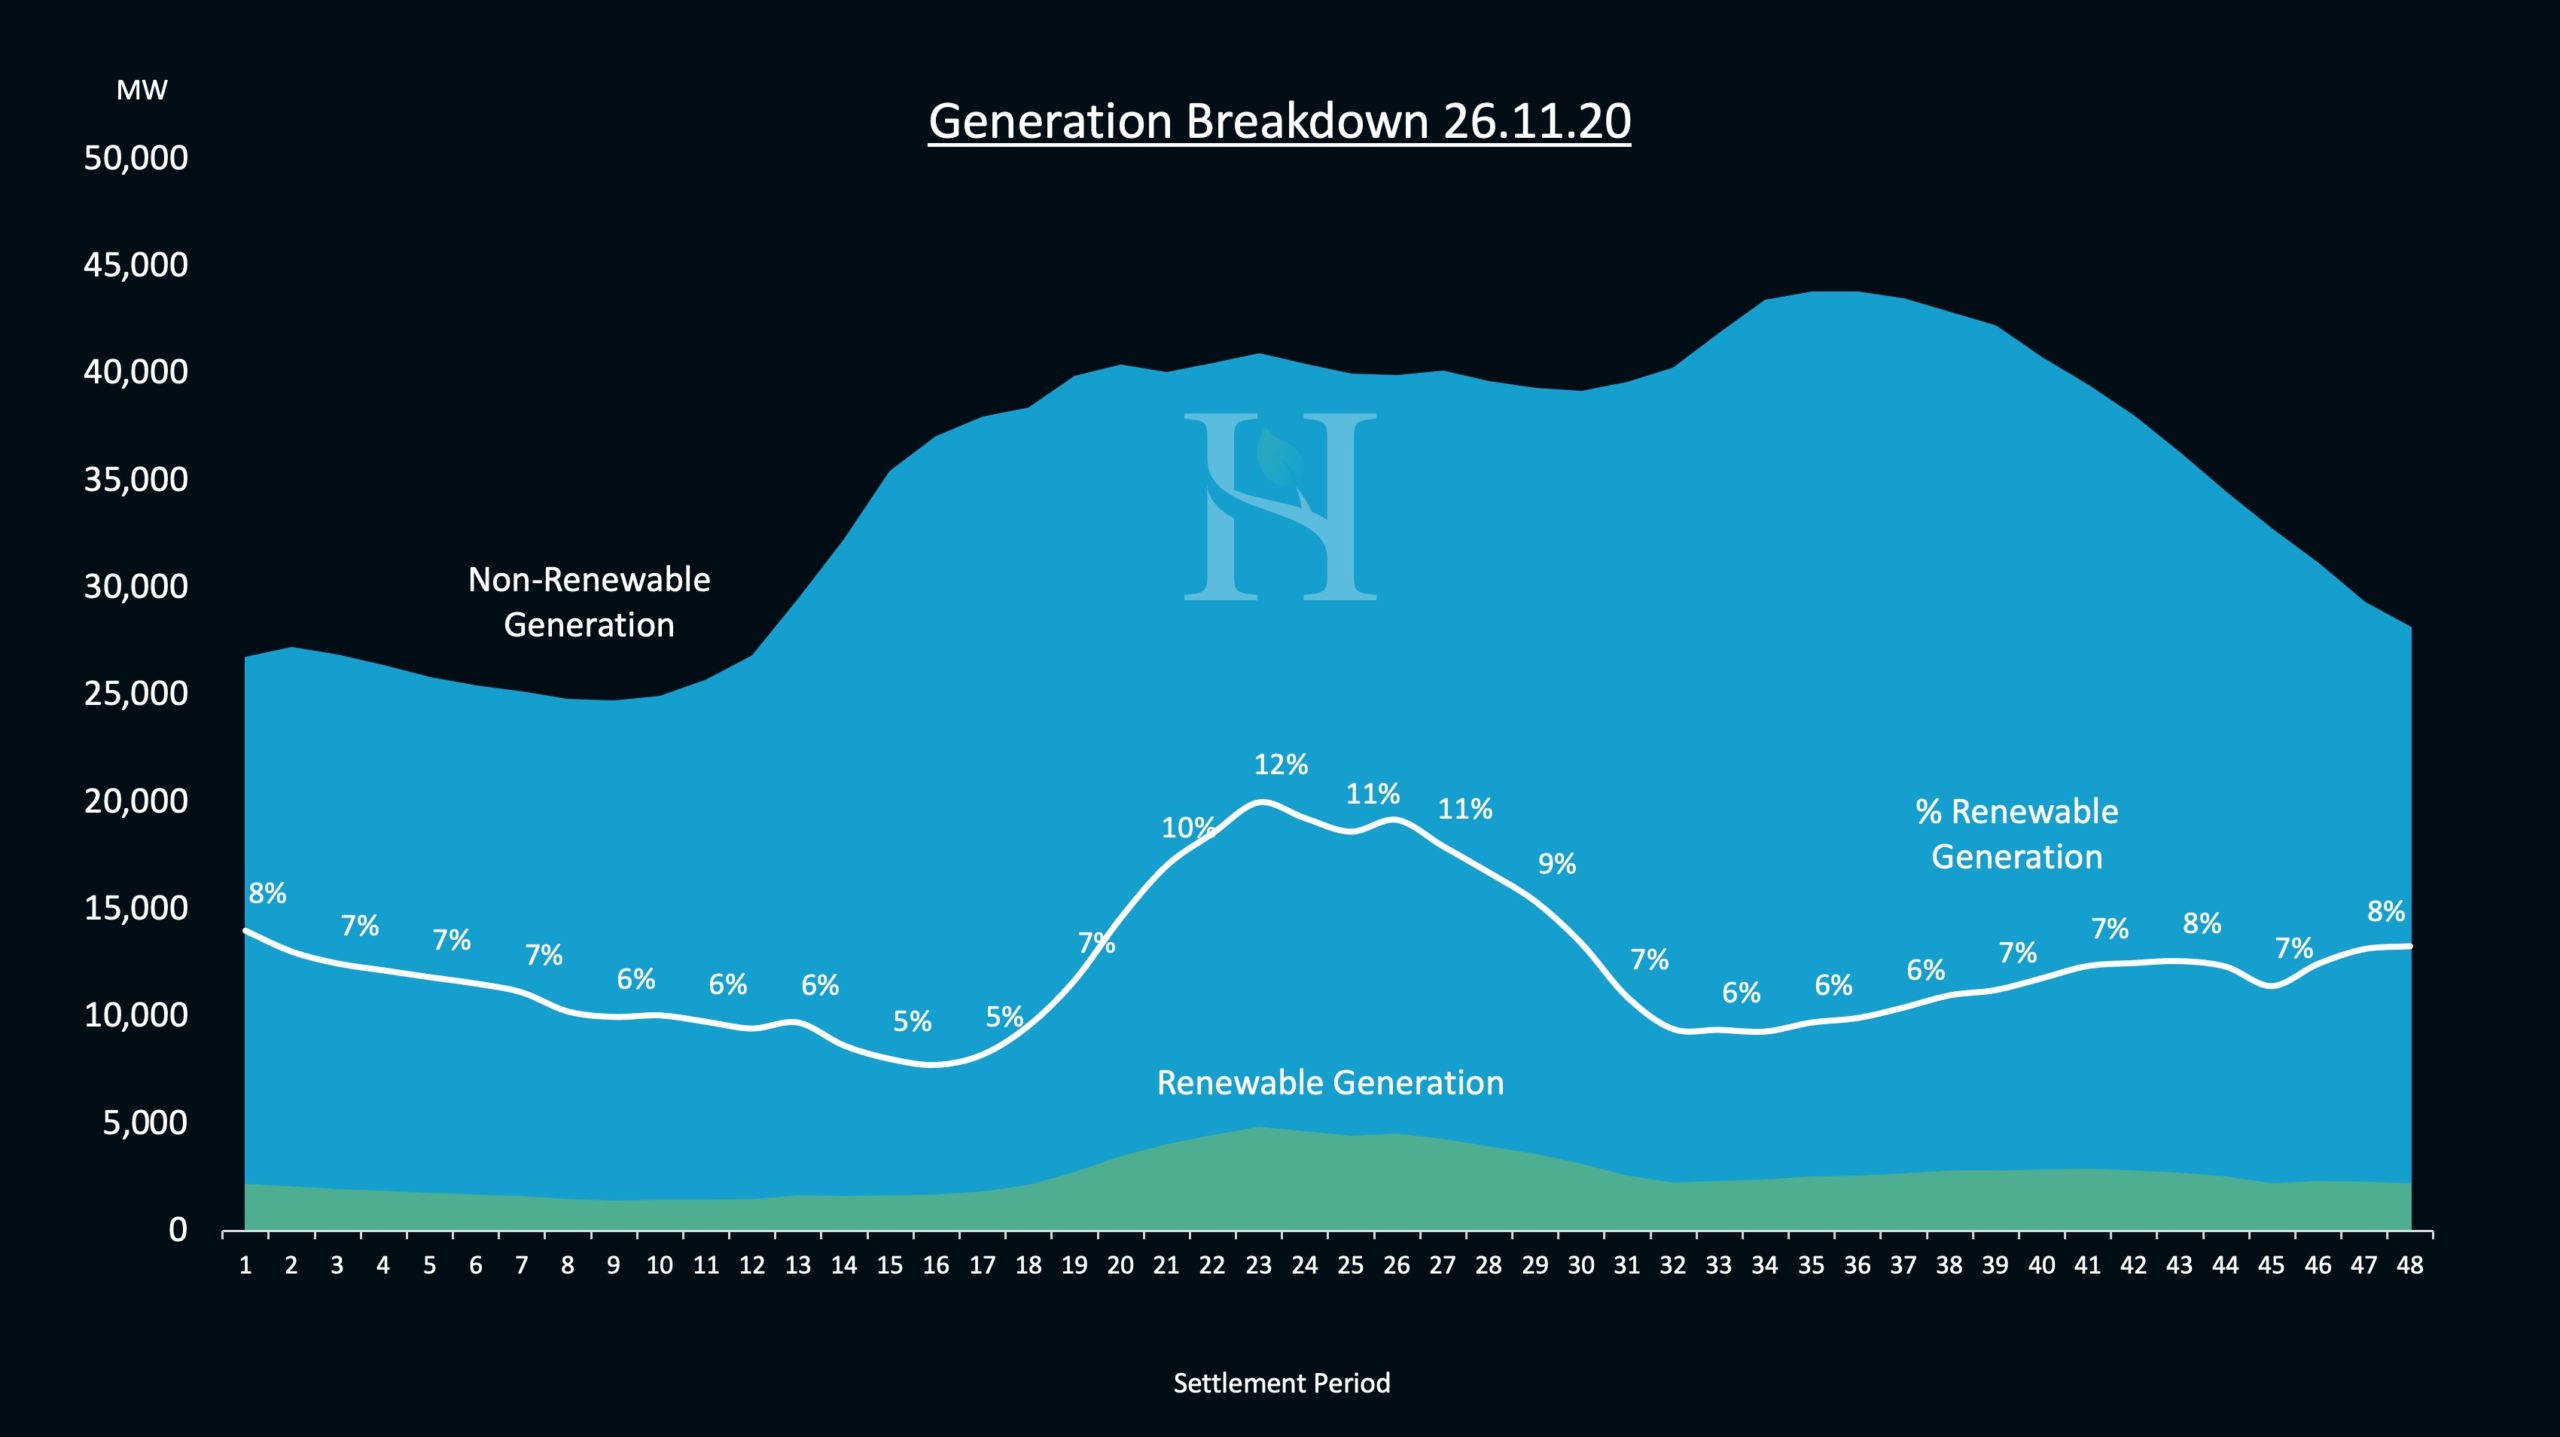
Most companies and businesses similarly look at their annual carbon intensity rather than a more granular measure. Usually, this is for ease and a lack of data available. It leads to public announcements which boast of ‘purchasing 100% renewable generation’. We believe these can be misleading as it is unclear how their electricity is generated when the wind doesn’t blow or the sun doesn’t shine.
We only need to look back at 26th Nov ’20 where renewable generating made up only 7% of total generation over the day. On days like these, claims of a grid-connected user’s electricity being 100% renewable are questionable.
The Challenges that Lie Ahead
The reality is that the UK network is some years away from being able to provide economic solutions for 24/7 low carbon generation. And this is a reality that we as an industry need to better understand and be more open and transparent about.
Delving deeper still, we have charted the UK power generation units that most frequently set the marginal price and then animated them to be sorted by carbon intensity to further highlight the breakdown in correlation between those aspects.
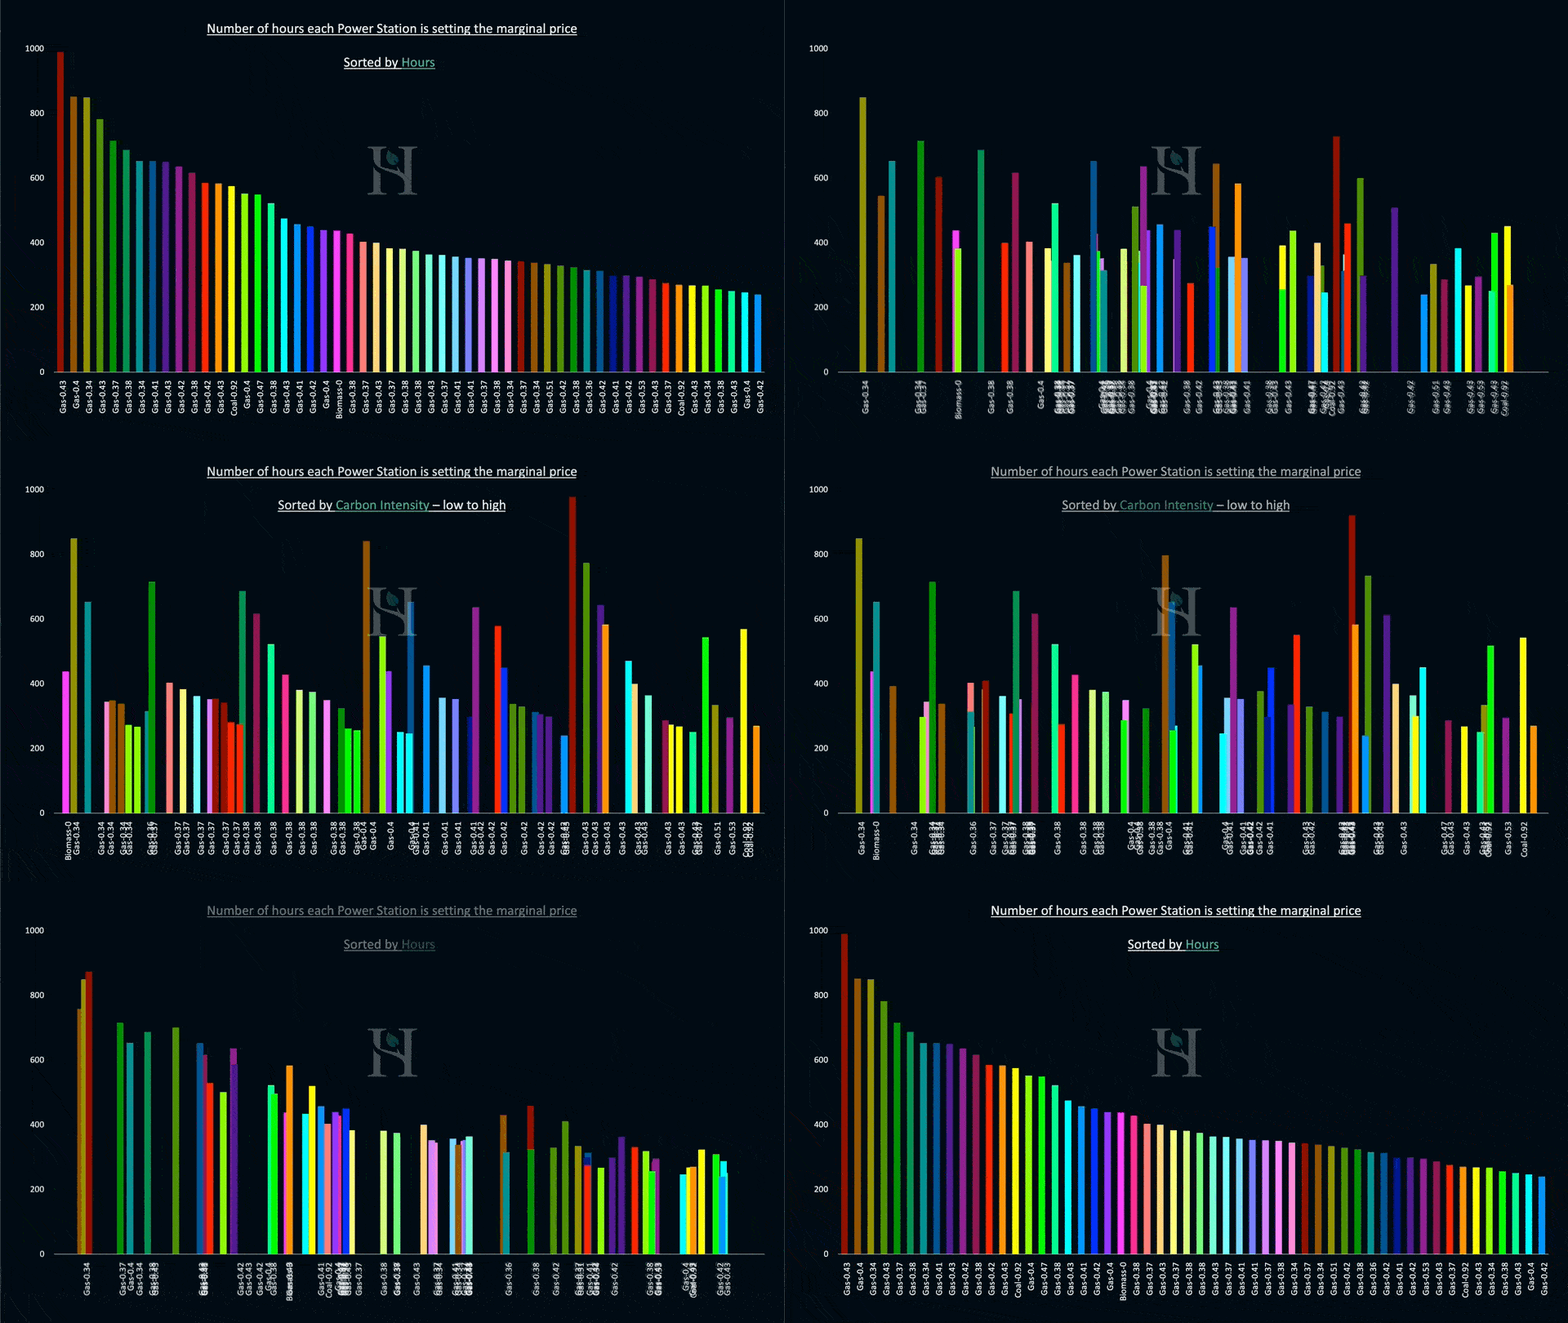
Any action we take, say via on-site generation, which displaces a marginal unit and reduces emissions from the grid should be the measure against which we consider the impact of that action.
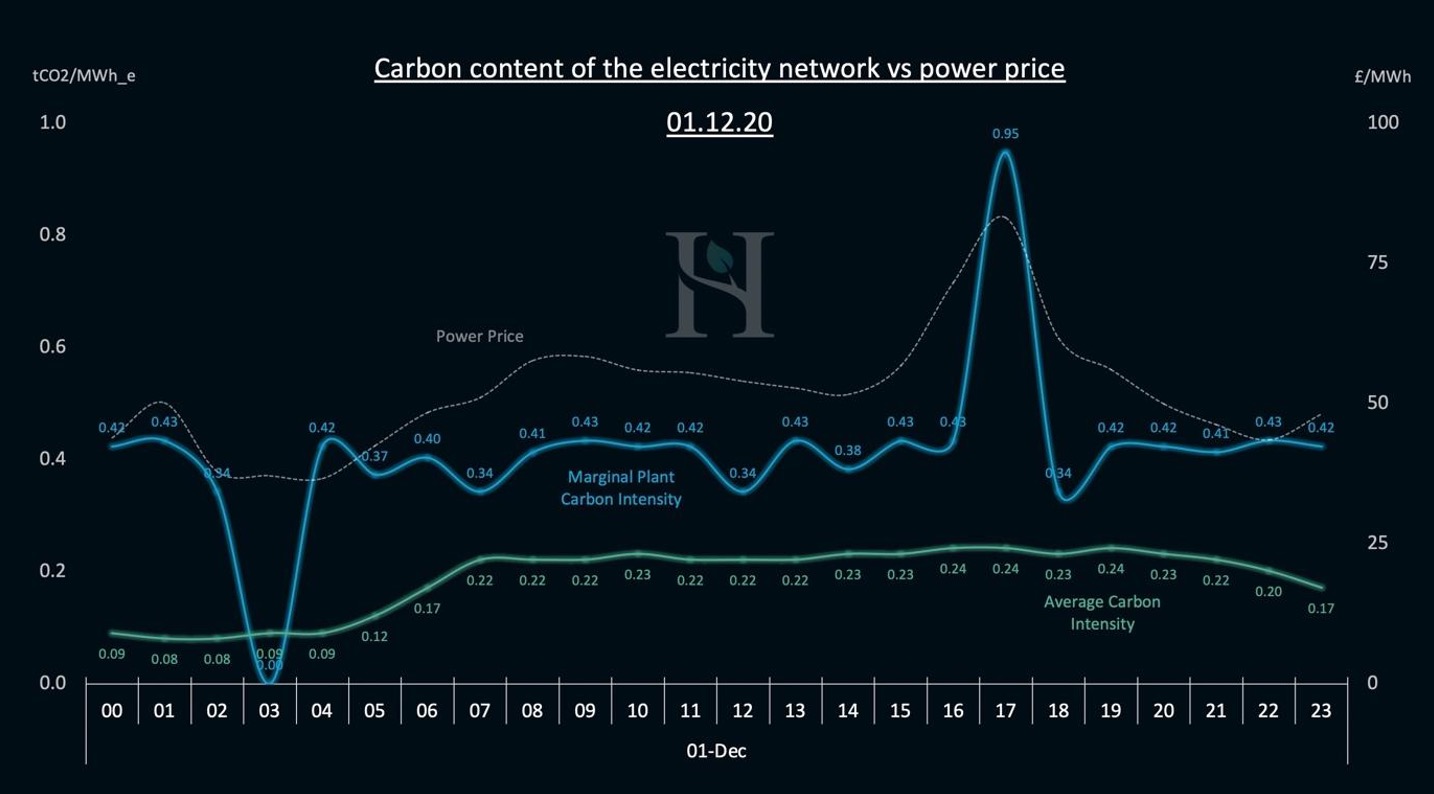
There is also a wide variation in the volume of carbon emissions that are offset depending on the exact timing of the action. All hours are not equal. This becomes clear when we look at a specific day using our in-house modelling between the impact of our action on carbon emitted into the UK atmosphere on an hourly basis.
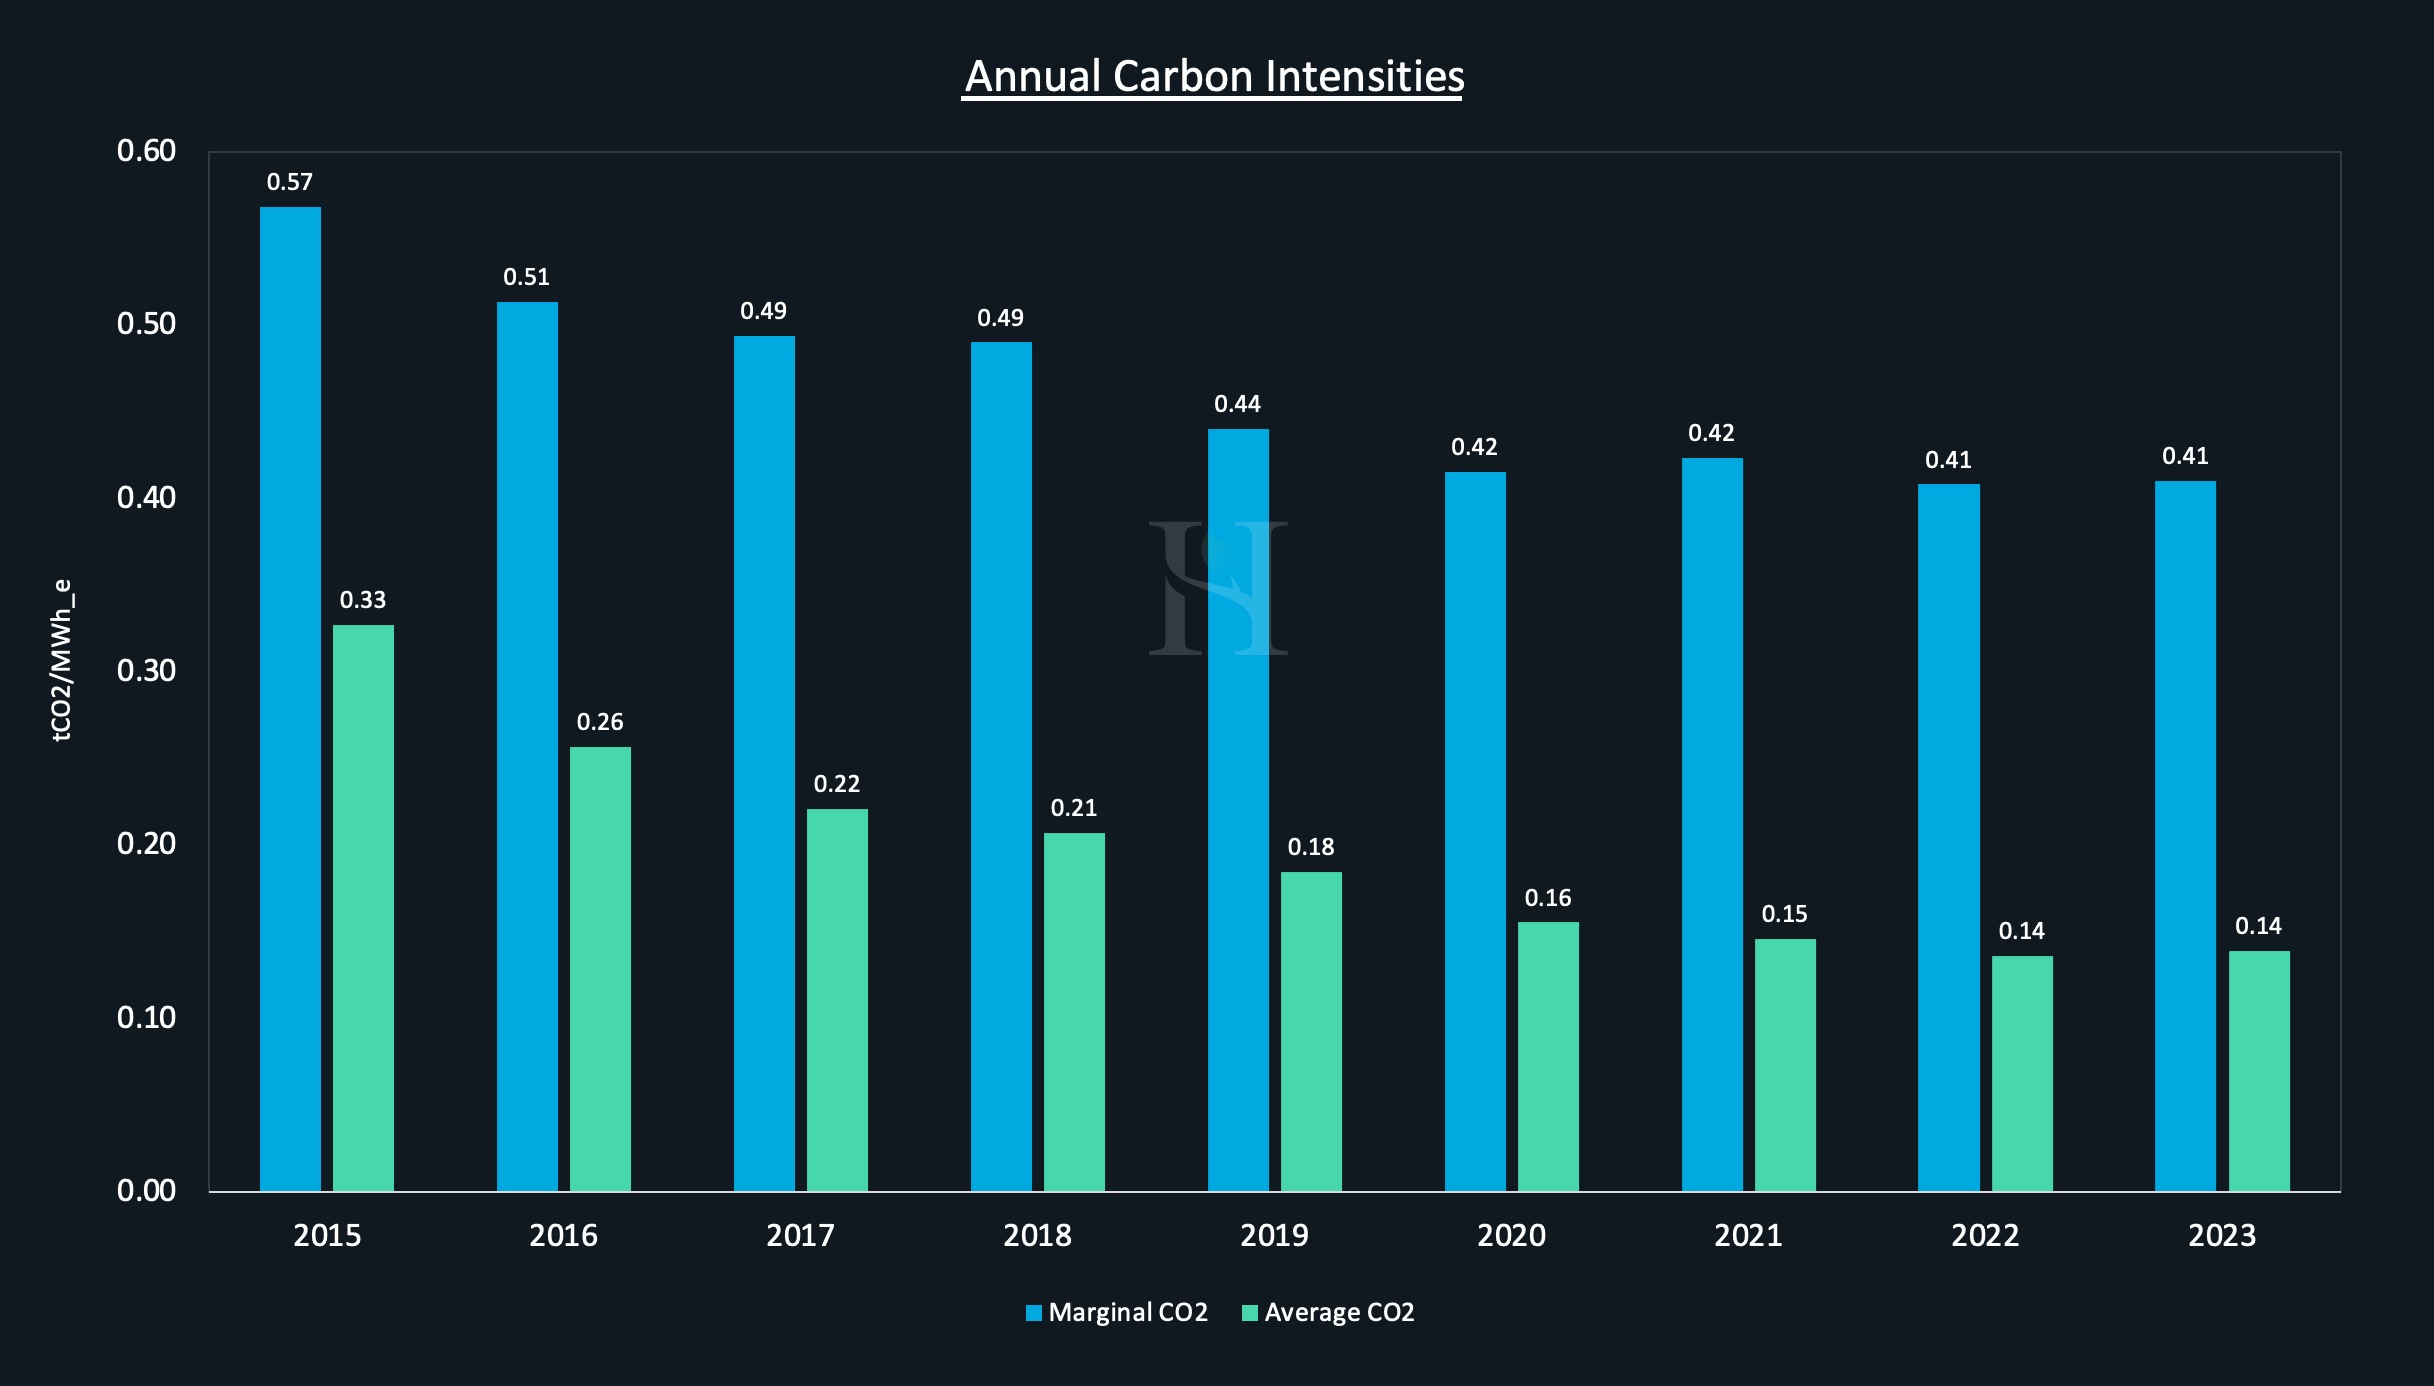
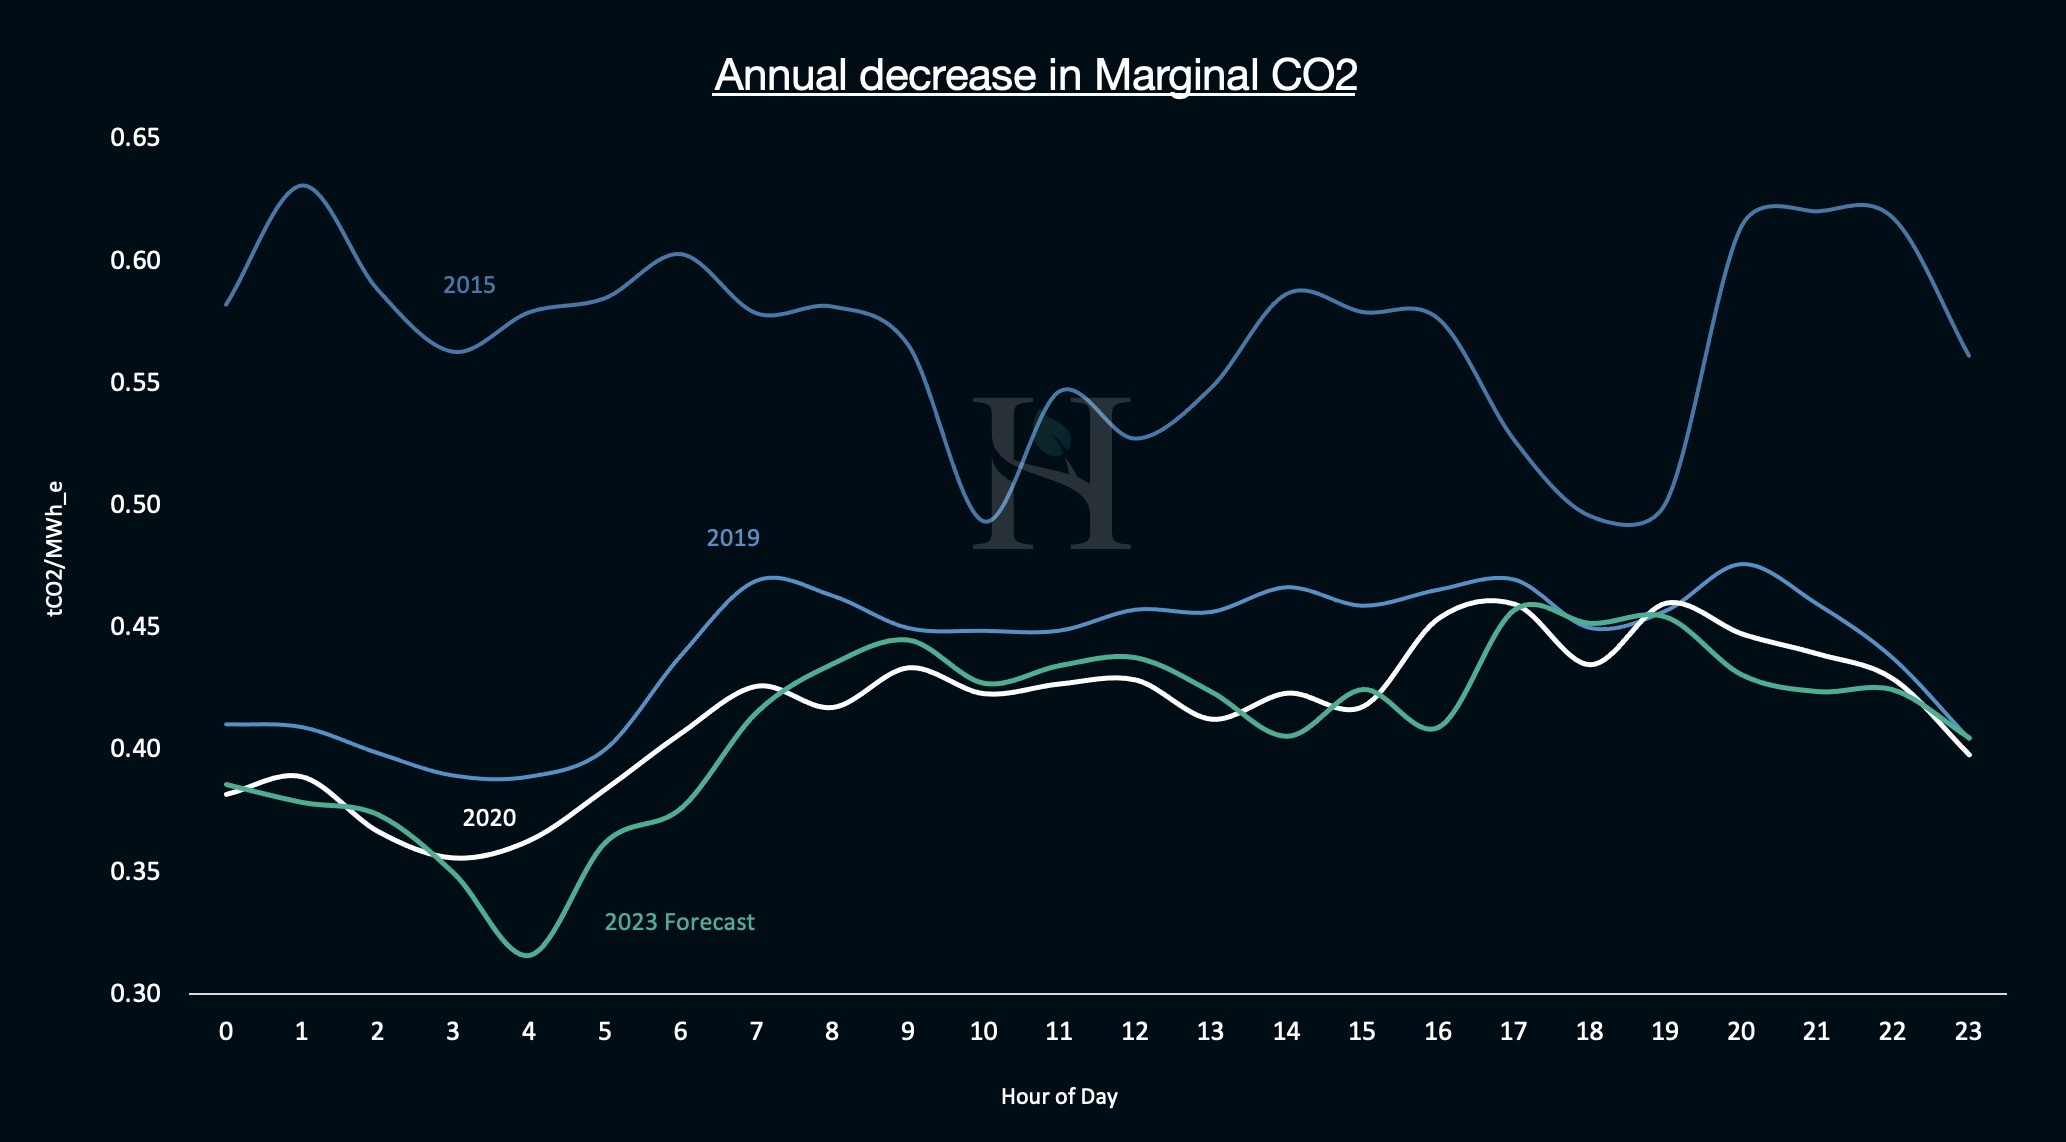
Much like the total emissions chart in Part 1, we can see the average tCO2/MWhe has significantly and consistently decreased over time as has the marginal equivalent.
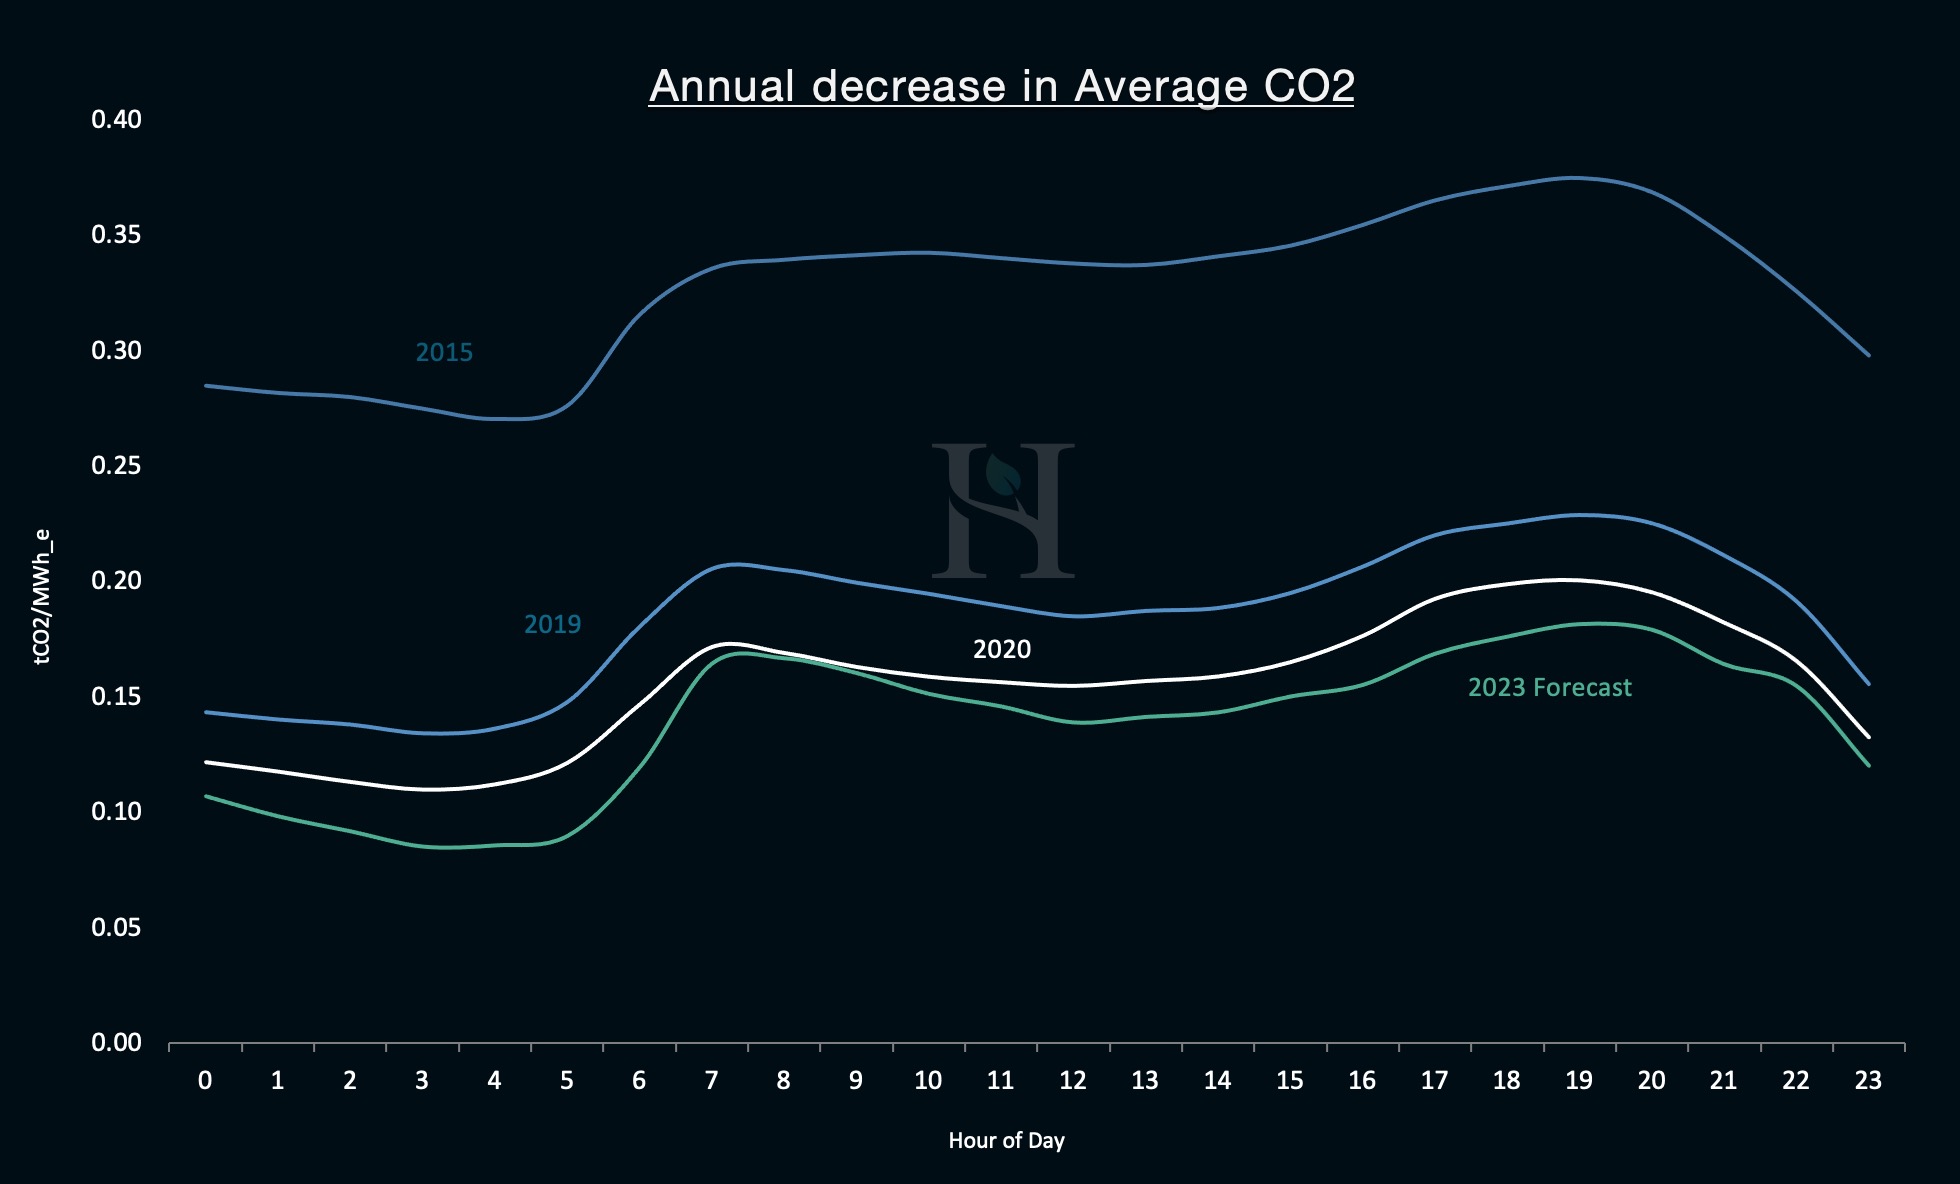
Additionally, displayed over a 24-hour day we can see the importance of analysing any effort to reduce carbon emissions on an hourly basis both on an average and marginal basis. Again, we see a large drop from 2015 as gas has largely replaced coal as the marginal unit. The impact of Covid-19 has led to a big fall from 2019 to 2020 but our analysis indicates that declining trend is set to halt by 2023.
As mentioned in the first article in this series, the easy switches have been exhausted and the real challenges lie ahead. Further evidence of this since we released Part 1 is the prequalification result for the upcoming Capacity Market auction for the delivery year 2024/25. Even four years from now the makeup of reliable generation to insure against blackouts is little changed in its carbon makeup with gas generation continuing to be both relied upon and constructed in the medium term.
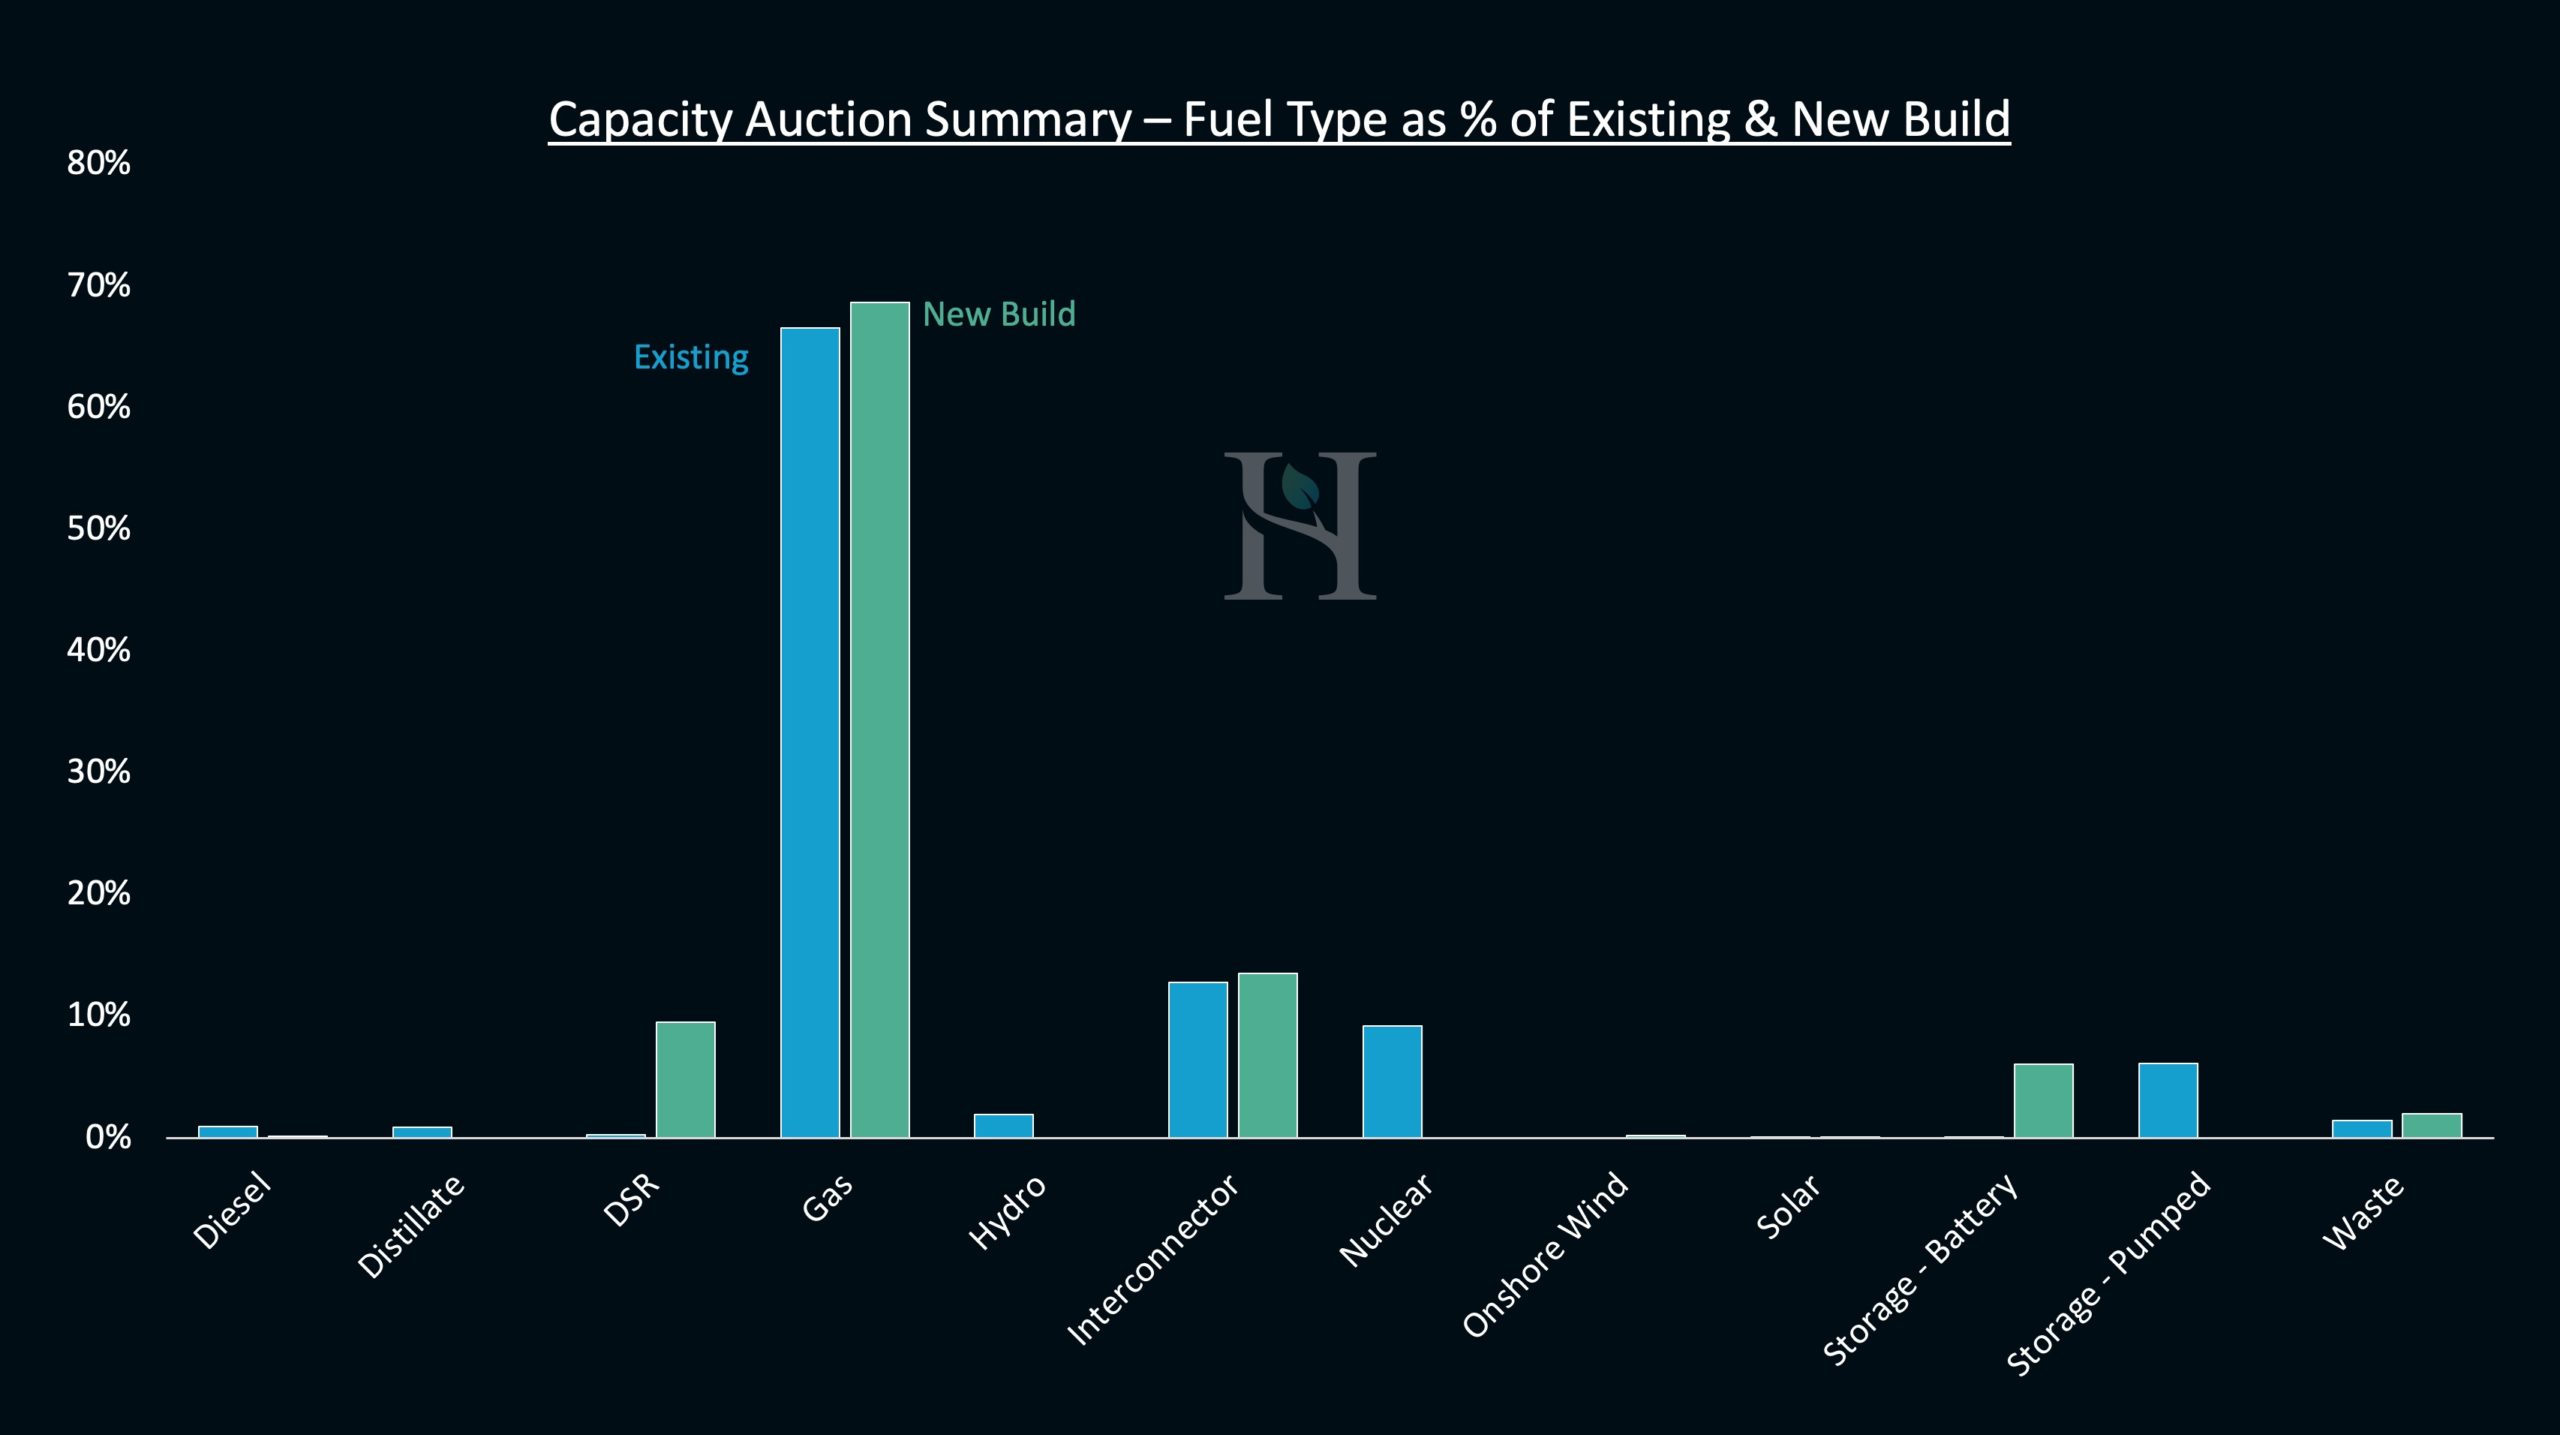
Material carbon reductions from a change of fuel type or technology are not on the immediate horizon in the same way we have experienced over the last five years. We must therefore work harder to reduce our impact on emissions. However, the granular approach adopted by Hartree Solutions can make this achievable, certainly from an individual company’s perspective. We measure the carbon savings from your actions utilising new or existing generation assets. These assets can be optimised to reduce costs, carbon emissions or a combination of both. In the latter, of course, there is a trade-off between reducing costs and reducing emissions and how we balance those two desires. This is where we believe our partners should not only have open transparent data to make this decision but also set these goals themselves.
Ultimately, not all emissions can currently be reduced to zero at source in an economical manner. Therefore, we offer a best-in-class set of carbon offset solutions so each customer can strike their own balance.
No two customers will have the same basket of offsetting products. It is an open and bespoke solution to meet your needs, but Hartree Solutions can offer you a complete solution via directly connected additional renewable generation, optimization of flexible assets to further reduce emissions and completed by offsetting your entire business operation.
More Market Insights
Footnotes
1 68% reduction in greenhouse gas emissions
2 Volkswagen announcement
3 Sony hints at move away from Japan
4 The unit setting the imbalance price is derived via a complicated calculation as seen in this document by Elexon
5 The marginal price setting unit extracted from our model is our in-house estimate
6 The Christmas Day Carbon challenge is limited to one entry per person. Entries must be received before 00:01 on Christmas Day. Hartree’s modelling will be used to determine the maximum marginal carbon intensity for any hour on Christmas day. The winning entry is the one closest to the maximum value. Where there is a tie the first entry received will be the winning entry. No Hartree or Hartree affiliate employees will be eligible to win. For each unique entry received we will donate £10 to the winners verified charity of choice up to a cap of £5,000.

Adam Lewis


